Industrial procurement teams face persistent pressure to control spending without disrupting production. Chemical purchasing adds a layer of complexity: prices fluctuate with energy markets, logistics costs vary by region and season, and quality failures carry outsized operational consequences. Traditional cost-cutting measures—blanket purchase orders, annual rebate negotiations, or switching to the lowest bidder—often address the symptoms of high chemical procurement costs but not the structural drivers behind them.
The challenge is compounded by the fragmented nature of chemical supply chains. A single manufacturing facility may source dozens of commodity and specialty chemicals across multiple suppliers, each with different pricing models, lead times, and quality documentation. Without a structured approach to spend analysis, specification management, and supplier consolidation, procurement teams routinely leave 8–15% of potential savings on the table.
Calcium chloride, one of the most widely used industrial salts in de-icing, dust control, concrete acceleration, and food processing, exemplifies the broader dynamics of chemical procurement. Its price is heavily influenced by production method (synthetic vs. by-product), concentration, packaging format, and freight distance—variables that procurement professionals can leverage to secure more favorable terms.
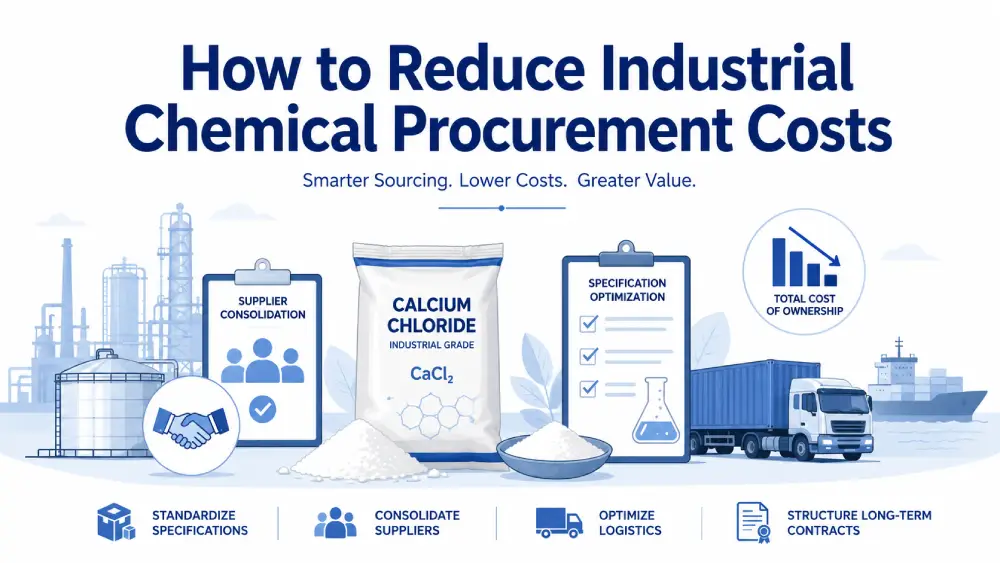
The core answer to reducing industrial chemical procurement costs is straightforward: cost reduction is achievable when procurement teams shift from transactional buying to structured category management. The main levers are specification optimization, supplier consolidation, freight and packaging rationalization, and long-term contract structuring—each of which is explained in detail below.
What This Article Covers
- How to audit and classify your chemical spend by category, grade, and supplier
- Why calcium chloride pricing varies by concentration, form, and production source
- How to build a structured supplier evaluation and negotiation framework
- Where freight, packaging, and inventory policies create hidden cost savings
- How to implement long-term contracts with price adjustment mechanisms
- Bottom line: Reducing chemical procurement costs is a systematic process of specification alignment, supplier rationalization, and total cost modeling—not simply chasing the lowest unit price.
What Drives Chemical Procurement Costs
Chemical procurement costs are determined by more than the price per ton on an invoice. Total cost of ownership includes raw material cost, freight, packaging, quality assurance, inventory carrying cost, and administrative overhead. Procurement teams that negotiate exclusively on unit price often overlook cost drivers that represent 20–30% of total spend.
Raw Material and Production Cost Variables
For calcium chloride, production method is the single largest determinant of base price. Synthetic calcium chloride—produced through the reaction of hydrochloric acid with limestone—typically commands a higher price than by-product calcium chloride recovered from Solvay process waste streams or natural brine concentration. The price differential between synthetic and by-product material can reach 15–25%, depending on market conditions.
Beyond production method, concentration drives cost. Calcium chloride is sold in forms ranging from 77% flakes to 94–97% pellets, 35–45% liquid solutions, and anhydrous grades above 94%. Higher concentration means lower water content, which reduces freight cost per active ton but raises unit price per ton. Procurement teams must calculate the delivered cost per active unit—not per ton—to compare suppliers accurately.
Freight and Logistics Cost Drivers
Freight often represents 10–30% of total landed cost for commodity chemicals. For high-density materials like calcium chloride flakes and pellets, truckload utilization and distance from production facility to delivery site are the primary variables. A plant located 200 miles from a supplier may pay $40–60 per ton in freight, while a facility 800 miles away could pay $110–160 per ton for the same material.
Seasonal demand spikes also affect logistics pricing. Calcium chloride demand peaks in winter months for de-icing applications and in summer for dust control on unpaved roads. Procurement teams that schedule deliveries during off-peak periods or negotiate carrier contracts independent of supplier freight can reduce logistics costs by 5–12%.
Packaging, Grade, and Specification Costs
Packaging format—bulk, supersacks, 50-lb bags, or liquid tanker—affects both unit price and handling labor at the receiving facility. Bagged material costs more per ton than bulk, but may reduce material loss and simplify inventory management. Specification requirements such as food-grade certification, low-alkali content for concrete applications, or specific particle size distribution add cost through additional processing and testing.
The table below summarizes the primary cost drivers and their typical impact range:
| Cost Driver | Description | Typical Impact on Total Cost |
|---|---|---|
| Production method | Synthetic vs. by-product vs. natural brine | 15–25% price differential |
| Concentration/grade | 77% flakes vs. 94% pellets vs. 35% liquid | 10–30% per active ton |
| Packaging format | Bulk vs. supersack vs. bags vs. tanker | 5–15% per ton |
| Freight distance | Distance from production site to delivery | 10–30% of landed cost |
| Order volume and frequency | Truckload vs. LTL, spot vs. contract | 8–20% price differential |
| Quality certifications | Food-grade, NSF, low-alkali, particle specs | 5–15% price premium |
How to Audit Chemical Spend and Identify Savings Opportunities
Before negotiating with any supplier, procurement teams need a complete picture of current chemical spend. A structured spend audit typically uncovers 3–8% in immediate savings through specification corrections, duplicate SKU consolidation, and supplier overlap elimination.
Step 1: Classify All Chemical Purchases by Category
Group every chemical purchase into categories based on function and application. For example, calcium chloride might appear in multiple categories: de-icing agent, dust suppressant, concrete accelerator, and food processing aid. Each application may have different grade requirements, allowing consolidation or grade standardization across categories.
Build a spend cube that maps:
- What is being purchased (chemical name, CAS number, grade, concentration, packaging)
- Who is buying it (facility, department, cost center)
- From whom (supplier, manufacturer vs. distributor, contract terms)
Step 2: Calculate Delivered Cost Per Active Unit
Unit price per ton is an unreliable comparison metric when concentrations, moisture content, and packaging differ. For calcium chloride, convert all purchases to delivered cost per active ton:
Delivered cost per active ton = (Invoice price + Freight + Handling) ÷ (Active ingredient percentage)
A 77% flake product priced at $320 per ton with $90 freight delivers active material at $532 per active ton. A 94% pellet product priced at $410 per ton with $90 freight delivers at $532 per active ton as well—the apparent price difference disappears when normalized. This calculation alone often reveals that a "cheaper" product is actually more expensive.
Step 3: Identify Specification Overlap and Redundancy
Multiple facilities often purchase the same chemical under different internal part numbers or with slightly different specifications. A procurement audit may find three facilities buying calcium chloride pellets at three different concentrations—77%, 83%, and 94%—for the same dust control application. Standardizing on one specification reduces SKU count, increases order volume per SKU, and strengthens negotiation leverage.
Checklist for Chemical Spend Audit
- Classify every chemical purchase by application category and grade
- Normalize all pricing to delivered cost per active unit
- Flag duplicate specifications across facilities and departments
- Identify low-volume, high-frequency orders that qualify for consolidation
- Map freight costs separately from material costs for every supplier
- Review whether packaging format matches actual consumption patterns
- Document quality requirements per application to avoid over-specification
- Calculate inventory carrying cost for slow-moving chemical inventory
- Benchmark current pricing against market indices or published price ranges
Why Supplier Consolidation Reduces Chemical Procurement Costs
Supplier consolidation is one of the most reliable cost reduction levers in chemical procurement. Reducing the number of active chemical suppliers from, say, 25 to 8–10 concentrate volume with fewer partners, reduce administrative overhead, and simplify quality management. However, consolidation must be executed strategically—over-consolidation can create single-source dependency risk.
The Volume Leverage Effect
When a procurement team consolidates calcium chloride purchases from four suppliers into one or two, the volume awarded to the remaining suppliers increases substantially. A supplier receiving 2,000 tons per year can offer significantly better pricing than one receiving 400 tons. The price reduction from volume concentration typically ranges from 5–15%, depending on the chemical category and market conditions.
The Administrative Cost Reduction
Every active supplier relationship carries administrative costs: vendor onboarding, contract management, purchase order processing, invoice handling, quality documentation, and performance monitoring. Industry benchmarks suggest that each active supplier costs $2,000–8,000 per year in administrative overhead alone. Reducing supplier count from 25 to 10 can save $30,000–120,000 annually in pure administrative costs, independent of any price negotiation.
Risk-Balanced Consolidation Framework
Consolidation should never eliminate competitive tension entirely. The following framework guides supplier consolidation decisions:
Choose supplier consolidation when:
- The chemical is a commodity with interchangeable specifications across suppliers
- Two or more current suppliers provide the same grade with comparable quality history
- Freight lanes overlap significantly between suppliers
- Current order volume per supplier is below truckload minimums
- Quality documentation requirements are consistent across applications
Maintain multiple suppliers when:
- The chemical is a specialty product with limited alternative sources
- Supply chain disruption risk is high (e.g., single production facility, weather-dependent production)
- Quality requirements differ significantly across applications, requiring different grades
- Market pricing is volatile and competitive bidding provides price discovery benefits
How to Optimize Calcium Chloride Specifications for Cost Efficiency
Specification optimization is the most underutilized cost reduction lever in chemical procurement. Many facilities over-specify chemical requirements out of caution, habit, or lack of engineering review. Aligning specifications with actual application requirements can unlock 5–20% in savings without any supplier negotiation.
Concentration Selection: Matching Grade to Application
Calcium chloride is available in multiple concentrations, and the optimal choice depends on the application:
| Application | Optimal Concentration | Cost Efficiency Note |
|---|---|---|
| Concrete acceleration | 77–83% flakes | Lower concentration adequate; pellets unnecessary |
| Dust control | 35–38% liquid or 77% flakes | Liquid minimizes handling labor; flakes for remote application |
| De-icing | 83–94% pellets | Higher concentration extends working temperature range |
| Food processing | Food-grade 94%+ | Regulatory requirement overrides cost considerations |
| Brine production | 77% flakes or 94% pellets | Depends on dissolution rate required |
Form Selection: Flakes vs. Pellets vs. Liquid
The physical form of calcium chloride affects both purchasing cost and operational efficiency. Pellets typically cost 8–15% more than flakes for equivalent concentration due to additional processing. However, pellets generate less dust during handling and dissolve more uniformly, which may justify the premium in automated feed systems.
Liquid calcium chloride (35–45% solution) eliminates on-site dissolution labor and dust control concerns but involves transporting 55–65% water. For facilities within 150–200 miles of a liquid production site, the delivered cost per active ton of liquid can be competitive with solid forms. Beyond that distance, the freight cost of transporting water erodes the economic advantage.
Avoiding Over-Specification
Over-specification occurs when procurement teams order a higher grade than the application requires. Examples include:
- Ordering food-grade calcium chloride for de-icing when technical grade would suffice
- Specifying low-alkali material for applications where alkali content is irrelevant
- Requiring 94% pellets when 83% flakes meet performance requirements
Each unnecessary specification requirement adds 5–15% to unit price. A systematic review of specification requirements against actual application needs typically identifies 2–4 over-specified chemicals in a typical industrial facility.
How to Structure Long-Term Chemical Supply Agreements
Long-term supply agreements reduce chemical procurement costs through price stability, volume commitment leverage, and reduced transactional frequency. However, poorly structured agreements can lock procurement teams into unfavorable pricing when market prices decline.
Price Adjustment Mechanisms
A well-designed long-term agreement includes a transparent price adjustment mechanism tied to an independent market index or input cost benchmark. For calcium chloride, common reference points include:
- Natural gas price indices (production energy input)
- Freight rate indices (transportation cost component)
- Hydrochloric acid market prices (synthetic production feedstock)
- Published chemical price benchmarks (e.g., ICIS, ChemAnalyst)
The agreement should specify the index, the adjustment formula, the frequency of adjustment (quarterly or semi-annually), and the notice period. This protects both parties from extreme market movements while eliminating the need for constant renegotiation.
Volume Commitments and Tiered Pricing
Tiered pricing structures reward higher purchase volumes with progressively lower unit prices. A typical tier structure for calcium chloride might look like:
| Annual Volume Tier | Typical Price Discount vs. Spot |
|---|---|
| 100–499 tons | Baseline |
| 500–999 tons | 4–7% below baseline |
| 1,000–2,499 tons | 7–12% below baseline |
| 2,500+ tons | 10–18% below baseline |
Procurement teams should base volume commitments on realistic consumption forecasts, not aspirational volumes. Failing to meet a committed volume tier can trigger retroactive price adjustments or contractual penalties that erode the expected savings.
Contract Duration and Renewal Strategy
For commodity chemicals like calcium chloride, contract terms of 2–3 years with annual price review provide a balance of stability and flexibility. Longer terms (4–5 years) may secure deeper initial discounts but increase the risk of being locked into above-market pricing if market conditions shift.
Include a benchmark clause that allows either party to request a price review if the reference index moves beyond a specified threshold (e.g., ±10% from the baseline index value).
What Is the Fastest Way to Reduce Chemical Procurement Costs
The fastest way to reduce chemical procurement costs is to stop buying on spot market terms and move all regular chemical purchases to structured agreements. Spot purchases typically cost 10–25% more than contract pricing for the same product, and they introduce supply reliability risk. This is a conditional conclusion: spot buying is appropriate for emergency purchases and price discovery, but it should represent less than 10% of total chemical spend.
The main causes of unnecessarily high chemical procurement costs are:
- Spot market dependence for regular chemical purchases
- Fragmented purchasing across multiple facilities without spend coordination
- Inefficient order patterns (LTL shipments instead of truckloads)
- Over-specification of chemical grades and packaging requirements
- Failure to normalize pricing per active unit, leading to false cost comparisons
Addressing these five factors through the structured approach outlined in this article delivers measurable cost reduction within 60–120 days.
How to Calculate Total Cost of Ownership for Chemical Purchases
Total cost of ownership (TCO) calculation is essential for comparing chemical suppliers accurately. TCO goes beyond invoice price to include all costs incurred from order placement through consumption.
TCO Formula for Industrial Chemicals
TCO per ton = Material price + Freight + Packaging + Handling labor + Quality testing + Inventory carrying cost + Waste/loss adjustment
For calcium chloride, a sample TCO comparison illustrates the methodology:
| Cost Component | Supplier A (Pellets) | Supplier B (Flakes) |
|---|---|---|
| Invoice price per ton | $420 | $385 |
| Freight per ton | $85 | $85 |
| Packaging included | Yes | Yes |
| Handling labor per ton | $8 | $12 (dust issues) |
| Quality testing per lot | $150 | $150 |
| Inventory carrying (30 days) | $21 | $19 |
| Waste/loss adjustment | 1% ($4) | 2% ($8) |
| TCO per ton | $538 | $509 |
The $35 per ton invoice price advantage narrows to $29 in TCO terms, and if the flakes product causes even modest operational disruption, the apparent savings can evaporate entirely.
When to Use TCO vs. Price-Only Comparison
Use TCO comparison when:
- Comparing products with different packaging formats or concentrations
- Evaluating suppliers at significantly different distances
- Assessing materials with different handling characteristics
- Making decisions with annual spend impact above $50,000
Price-only comparison is acceptable when:
- Products are identical in specification, form, and packaging
- Suppliers are in the same geographic region
- Order volumes are small and one-time in nature
Why Freight Optimization Multiplies Procurement Savings
Freight optimization is frequently overlooked in chemical procurement cost reduction programs, yet it often represents the single largest opportunity beyond price negotiation. For bulk industrial chemicals like calcium chloride, delivered cost can vary by 20–40% based purely on logistics decisions.
Truckload vs. LTL Economics
Less-than-truckload (LTL) shipments cost 30–60% more per ton than full truckload shipments for the same material. A procurement team ordering 15 tons of calcium chloride per month via LTL might pay $180 per ton in freight, while the same material shipped as a full 24-ton truckload costs $85–100 per ton. Consolidating monthly orders into quarterly truckload deliveries saves $1,200–1,600 per truckload in freight costs.
The trade-off is inventory carrying cost. If the quarterly order requires holding $8,000 in inventory for 60 extra days at a 12% annual carrying cost rate, the carrying cost is approximately $160—far less than the freight savings. For most commodity chemicals, inventory carrying cost is significantly lower than LTL freight premiums.
Backhaul Opportunities and Delivery Scheduling
Carriers often have unused capacity on return trips from delivery points. Procurement teams that can accept flexible delivery windows—allowing carriers to schedule deliveries when backhaul capacity is available—can negotiate freight discounts of 10–20%. This requires coordination between procurement, logistics, and receiving operations.
Supplier Proximity as a Strategic Factor
For chemicals with low value-to-weight ratios like calcium chloride, supplier proximity is a primary cost driver. A supplier located 100 miles from the facility delivers material at roughly half the freight cost of a supplier 400 miles away. Procurement teams should evaluate whether the price premium from a closer supplier is justified by freight savings, even if the close supplier's invoice price appears higher.
How to Implement a Chemical Procurement Cost Reduction Program
Implementing a systematic cost reduction program requires disciplined execution across multiple workstreams. The following step workflow organizes the process into manageable phases.
Phase 1: Spend Analysis and Opportunity Identification (Weeks 1–4)
Step 1: Build the spend baseline. Compile 12 months of chemical purchase data, including invoice prices, freight costs, order volumes, and suppliers. Classify by chemical category and application.
Step 2: Normalize pricing per active unit. Convert all purchases to delivered cost per active ton using the formula in the spend audit section. This reveals the true cost picture and highlights apparently "cheap" purchases that are actually expensive.
Step 3: Identify the top 10 cost reduction opportunities. Rank opportunities by potential savings and implementation difficulty. Quick wins typically include specification standardization, SKU consolidation, and moving regular purchases from spot to contract.
Phase 2: Supplier Consolidation and Negotiation (Weeks 5–10)
Step 4: Select consolidation targets. Choose 2–4 chemical categories where supplier count exceeds what the volume justifies. Calcium chloride is a prime consolidation candidate when multiple facilities purchase from different distributors at similar specifications.
Step 5: Prepare negotiation packages. For each consolidation target, prepare a volume summary, specification requirements, delivery locations, and freight considerations. Approach selected suppliers with a complete package that shows the full volume opportunity.
Step 6: Run a structured negotiation process. Use a competitive RFP or direct negotiation with 2–3 qualified suppliers. Focus on delivered cost per active unit, not just invoice price. Include freight terms, payment terms, and quality guarantees in the negotiation scope.
Phase 3: Contract Structuring and Implementation (Weeks 11–16)
Step 7: Finalize long-term agreements. Implement the agreement structure outlined earlier: tiered pricing, index-based price adjustment, and 2–3 year terms with annual review.
Step 8: Update procurement systems and processes. Ensure that pricing, specifications, and delivery requirements are correctly captured in procurement systems. Train buyers on the new agreements and establish compliance monitoring.
Step 9: Monitor and measure results. Track actual savings against the baseline on a quarterly basis. Compare realized pricing to market indices to ensure contract pricing remains competitive.
How to Measure Chemical Procurement Cost Reduction Results
Measuring procurement savings requires a clear methodology. Savings should be calculated against a defined baseline using consistent assumptions.
Savings Calculation Method
Realized savings = (Baseline delivered cost per active unit − Actual delivered cost per active unit) × Actual volume purchased
The baseline should be the 12-month average delivered cost per active unit before the cost reduction program. Using delivered cost—not invoice price—captures savings from freight optimization and specification changes.
Key Performance Indicators
Procurement teams should track these KPIs monthly:
| KPI | Target | Measurement |
|---|---|---|
| Spend under contract | >80% | Percentage of chemical spend covered by long-term agreements |
| Spot buy percentage | <10% | Percentage of chemical spend purchased on spot market |
| Supplier count per category | 2–4 | Number of active suppliers per chemical category |
| Delivered cost per active unit | Declining | Monthly tracking against baseline |
| Savings realization | >90% of target | Actual savings vs. planned savings |
Continuous Improvement
Cost reduction is not a one-time event. Market conditions, supplier capabilities, and internal requirements change over time. Procurement teams should conduct a full spend audit annually and review contract performance quarterly. Ongoing monitoring identifies new savings opportunities and prevents cost creep from eroding prior gains.
Common Mistakes to Avoid in Chemical Procurement Cost Reduction
Even well-intentioned cost reduction programs fail when teams make avoidable errors. The following mistakes are the most frequent causes of suboptimal outcomes.
Mistake 1: Negotiating on Invoice Price Only
Many procurement teams focus exclusively on price per ton without considering freight, packaging, active ingredient concentration, or handling costs. This leads to the false conclusion that the lowest invoice price represents the best value. The fix: always compare delivered cost per active unit.
Mistake 2: Over-Consolidating Suppliers
Supplier consolidation reduces costs, but consolidation beyond 2–4 suppliers per category creates dangerous single-source dependency. If the sole supplier experiences a production disruption, the procurement team has no alternatives. The fix: maintain at least 2 qualified suppliers for every critical chemical category, even if one receives most of the volume.
Mistake 3: Ignoring Specification Requirements
Cost reduction should never come at the expense of application performance. Using a lower-cost calcium chloride grade in a food processing application could trigger regulatory violations or product quality failures that far exceed any procurement savings. The fix: involve engineering and quality teams in every specification change decision.
Mistake 4: Underestimating Freight Costs
Freight costs often represent 10–30% of landed cost for industrial chemicals, yet many procurement teams treat freight as a fixed unavoidable expense. The fix: separate freight from material pricing in supplier negotiations, explore backhaul opportunities, and evaluate supplier proximity as a strategic factor.
FAQs
What is chemical procurement?
Chemical procurement is the process of sourcing, negotiating, purchasing, and managing industrial chemicals for manufacturing, processing, or operational use. It includes supplier evaluation, specification management, contract negotiation, logistics coordination, and quality assurance. Effective chemical procurement balances cost, quality, supply reliability, and regulatory compliance to support production requirements.
How does calcium chloride concentration affect procurement costs?
Calcium chloride concentration directly affects procurement costs because higher concentrations command higher invoice prices while reducing freight cost per active ton. The key is comparing delivered cost per active unit:
- 77% flakes: lower invoice price, higher freight per active ton
- 94% pellets: higher invoice price, lower freight per active ton
- 35% liquid: lowest invoice price, highest freight per active ton
The optimal choice depends on application requirements, freight distance, and handling capabilities.
How long does it take to reduce chemical procurement costs?
The timeline for measurable chemical procurement cost reduction typically spans 60–120 days for initial savings and 6–12 months for full program implementation. Quick wins—such as moving regular purchases from spot to contract terms or standardizing specifications—can deliver 3–8% savings within the first quarter. Supplier consolidation and long-term agreement implementation require 3–6 months. Full category management programs deliver 10–20% total savings over 12–18 months.
Is bulk purchasing better than bagged purchasing for cost reduction?
Bulk purchasing typically costs 5–15% less per ton than bagged material for the same calcium chloride specification. However, bulk requires:
- Storage silo or containment infrastructure
- Adequate consumption rates to justify bulk deliveries
- Minimal material degradation concerns during storage
Bagged material makes sense for lower-volume applications or facilities without bulk handling infrastructure. Evaluate total landed cost including handling labor before switching formats.
What is the difference between synthetic and by-product calcium chloride?
Synthetic calcium chloride is produced through controlled chemical reactions using hydrochloric acid and limestone, resulting in consistent, high-purity material. By-product calcium chloride is recovered from other industrial processes, such as the Solvay process for sodium carbonate production. The difference matters for procurement because:
- Synthetic material typically costs 15–25% more but offers consistent quality
- By-product material may have more variable impurity profiles
- Both can meet technical-grade specifications for most de-icing and dust control applications
- Food-grade and pharmaceutical applications generally require synthetic material
How should procurement teams evaluate calcium chloride suppliers?
Procurement teams should evaluate calcium chloride suppliers on a structured scorecard covering five dimensions:
- Price competitiveness: delivered cost per active ton compared against market benchmarks
- Quality consistency: certificate of analysis compliance rate and customer complaint history
- Supply reliability: on-time delivery performance and production capacity
- Logistics capability: freight network coverage and delivery flexibility
- Service quality: responsiveness, technical support, and documentation accuracy
Score suppliers on each dimension, weight the scores according to business priorities, and re-evaluate annually.
What are the risks of switching calcium chloride suppliers?
Switching calcium chloride suppliers involves several operational and commercial risks:
- Quality variation: different suppliers may have slightly different impurity profiles or particle size distributions
- Supply disruption: new suppliers may not have sufficient capacity during seasonal demand peaks
- Logistics issues: unfamiliar freight lanes may experience longer transit times
- Specification compliance: new material may not perform identically in existing applications
Mitigation includes requiring trial shipments, validating material in actual applications, and maintaining overlap between old and new supplier relationships during transition.
How can procurement teams negotiate better calcium chloride prices?
Effective calcium chloride price negotiation starts with preparation:
- Normalize all competitive pricing per active ton delivered
- Understand market price drivers, including natural gas costs and seasonal demand
- Present the full volume opportunity across all facilities and applications
- Negotiate freight separately from material pricing
- Request tiered pricing based on realistic volume commitments
- Explore multi-year agreements with index-based price adjustments
Is it better to buy calcium chloride from manufacturers or distributors?
The manufacturer-versus-distributor decision depends on purchase volume and geographic location:
- Manufacturers typically offer better pricing for volumes above 500 tons per year and provide more specification transparency
- Distributors offer flexibility, local warehousing, and faster delivery for smaller volumes
- Distributors may provide value-added services like custom packaging or just-in-time delivery
- Large procurement programs often source directly from manufacturers while maintaining distributor relationships as backup
The right answer balances price, service requirements, supply chain resilience, and administrative efficiency.
What are the current market trends in calcium chloride pricing?
Calcium chloride pricing trends reflect several market forces:
- Natural gas prices influence production costs for synthetic material
- Winter de-icing demand creates seasonal price spikes in Q4 and Q1
- Construction activity affects demand for concrete acceleration applications
- Freight rates and driver availability impact delivered costs
- Production capacity expansions in key regions can moderate price increases
Procurement teams should monitor these factors and time purchases strategically to avoid seasonal premium pricing.
Conclusion
Reducing industrial chemical procurement costs requires a systematic approach that addresses specification, supplier structure, freight, and contract design. The core principle remains consistent: cost reduction is achieved when procurement teams shift from transactional buying to structured category management, comparing suppliers on delivered cost per active unit rather than invoice price alone.
The three highest-impact actions identified in this article are: first, conduct a thorough spend audit that normalizes all pricing per active unit and identifies specification overlap; second, consolidate suppliers strategically to concentrate volume without creating single-source dependency; and third, implement long-term agreements with tiered pricing and index-based adjustments that provide both cost stability and flexibility.
The right choice depends on your facility's application requirements, consumption volumes, and geographic location relative to production sources. Start by auditing your current chemical spend and calculating the delivered cost per active unit for every calcium chloride purchase. Benchmark your results against market references and identify the highest-impact opportunities before engaging suppliers. Then apply the structured negotiation and contract frameworks in this guide to convert opportunities into measurable, sustained savings.